/ Mathematics of Finance / Measuring Return /
Measuring Investment Returns
Why measure investment returns
Generating a return on your investments is the prime reason why you are investing. Naturally, you would like to measure these returns. Measurements form the basis for other actions such as portfolio construction, liability modelling, attribution analysis and risk management, among others.
Measuring returns (also known as pricing/unitization) is not as straightforward as one would think. It is an area where financial professionals often make mistakes. These mistakes are so frequent and of significant magnitude it is one the most expensive business activities to insure for financial firms. We highly recommend you cast an eye on your investment statements monthly and query any returns that look out of kilter.
You can perform a detailed attribution analysis, to understand the exact nature of your investments and pick up errors in this way. Or it can be as simple as comparing the returns on your statement with that of your husband/wife, assuming you have the same investments. There might be valid reason why the return differs: your wife may have made an additional investment on the 10th of the month and you on the 15th so she enjoyed 5 more days of growth.
Table of Contents
- Why Measure Investment Returns
- Calculating Holding Period Return
- Annualizing Returns
- Aggregation of Returns
- Compounding
- Continious Compounding
- Arithmetic Mean vs Geometric Mean
Holding Period Return
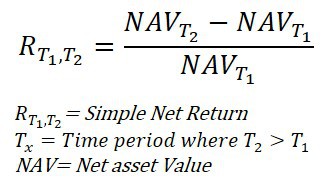
We will start our discussion on measuring returns with the most basic form commonly referred to as holding period return. Let us assume on 1 January in the morning you invest $100.00 in a share of a listed company, at that point your Net Asset Value (NAV) is $100. Exactly one year later 31 December your investment grew by 10% and your NAV is now $110. That 10% is what we call holding period return.
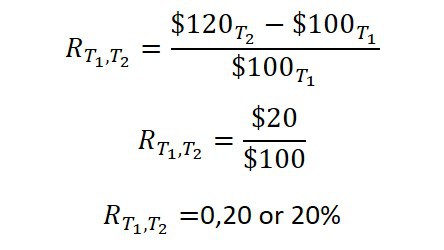
Let’s assume another year past and after 2 years your investment is now worth $120, your holding period return would be 20%. The calculation is straightforward we take the NAV at the end-of-year 1 ($110) and subtract the beginning NAV at year 1 ($100) and dived the answer ($10) by the NAV at the beginning ($100) to get 0.10. We then convert that number to a percentage by multiplying it by 100, so the holding period return is 10%. The formula looks like this:
|
If we place in the values for year two it would look like this:
|
2
Annualizing Returns
This results in an intersection between abundant choices and limited time, creating two issues that are critical to your decision-making process.
The first is how open to change are you, are you open to free uptime to explore multiple alternatives, or will you try to limit your time and effort and hence your choices?
The second choice is how open are you to leverage your time by relying on others. Are you self-reliant or will you call for advice?
Aggregation of Returns
People we call Searchers are those who are very self-reliant and not willing to accept help think of a gourmet chef that shops for his own ingredients plans and prepare a meal.
Compounding
introduction and give a high-level overview of the material and what each of the other 10 sections will cover. More importantly, it is also where be place background material to explain concepts that most with a degree in economics or finance would know but other would not. So we touch on the basics of economics, finance theory, etc. in the overview section.
Continious Compounding
At this point you will have a tain a comprehensive up-to-date knowledge repository to build courses and application on. As much as possible we deal with the principals and explain the tax/legal thinking, the actually application you would need to consult a professional that deals with this on a daily basis.
Arithmetic Mean vs Geometric Mean
People we call Searchers are those who are very self-reliant and not willing to accept help think of a gourmet chef that shops for his own ingredients plans and prepare a meal.